A major North American retailer needed to process two billion point-of-sale files. The existing architecture couldn’t survive two thousand. This is the story of the rebuild, the two dead ends we hit along the way, and the one design decision that made the whole thing scale.
The short version: the original pipeline wasn’t slow because the code was bad. It was slow because the architecture was the wrong shape for the problem. No amount of tuning fixes that. You have to change the shape.
The starting point
Point-of-sale XML arrives from thousands of stations every ten minutes, all day. Each file holds the transaction log for a window of activity at a site — one file per store session, across six POS vendors. They need to land in a queryable warehouse fast enough that the business can act on them.
The legacy stack was Azure Data Factory orchestrating Azure Durable Functions. It worked when the volume was small. As volume grew, it crawled. Then it simply stopped scaling.
Here are the two numbers that framed the entire project:
That is a gap of roughly 1,000×. When you are three orders of magnitude away from where you need to be, you are not looking at a performance bug. You don’t profile your way across a 1,000× gap by shaving milliseconds off a parser. The right question was never “how do we speed this up.” It was “why is this architecture wrong, and what is the right one.”
Three architectures, two dead ends
Attempt 1: optimize inside the existing model (ADF + Durable Functions)
The instinct, and the first thing we tried, was to make the existing approach faster. We treated it as an optimization problem.
We did real work here. We profiled the pipeline end to end. We rewrote the XML parsing to a single pass instead of multiple traversals. We chunked the files into manageable ranges. We added a thread pool to parse concurrently. These are all the right moves if the bottleneck is the work itself.
It wasn’t. When we measured where the time actually went, the result was uncomfortable:
Breaking the 98% down revealed two walls that were not tunable — they were structural.
The GIL. XML parsing is CPU-bound: ET.fromstring(), regex extraction, flattening deeply-nested structures into flat Parquet columns. Python’s Global Interpreter Lock serializes all CPU-bound work inside a single process. So threads don’t run in parallel on the cores — they queue up on one lock and take turns. CPU utilization sat at roughly 35% across four cores. The machine was mostly idle while the work waited on a lock.
The orchestrator’s design contract. A Durable Functions orchestrator must be deterministic — it has to be able to replay its own history to recover state. That requirement means the orchestrator function itself is forbidden from doing arbitrary I/O or spawning threads. The very thing we needed (cheap, uncoordinated parallelism) is the thing the programming model is designed to prevent.
You can't optimize your way out of an architecture that forbids what you need.
The model had to go.
Attempt 2: throw a distributed engine at it (Spark)
If the problem was that Python threads couldn’t parallelize CPU-bound parsing, the obvious next move was an engine built for exactly that. We moved the workload onto a distributed Spark cluster on Azure Databricks.
It worked, technically. A JVM-based engine like Spark has no GIL, so it genuinely parses across all cores in parallel. CPU utilization jumped from 35% to ~95%. The exact constraint that had capped the Functions approach was simply gone.
The implementation read all XML files in parallel with spark.read.text(), extracted fields with regex rather than full namespace-aware parsing (10–30 seconds for 1,000 files versus minutes for the namespace approach), and wrote Iceberg tables to ADLS Gen2:
# Parallel read across cluster — wholetext=True loads each file as one row
df = spark.read.text(path, wholetext=True, recursiveFileLookup=True)

# input_file_name() is not supported in Unity Catalog — use _metadata instead
df = df.withColumn("source_file", col("_metadata.file_path"))

# Regex extraction — faster than namespace-aware ET.fromstring across 6 vendors
site = re.search(r'<site[^>]*>(\d+)</site>', xml_content)
sales = re.search(r'<overallsales[^>]*>([^<]+)</overallsales>', xml_content)

# Archival — parallel native write instead of sequential dbutils.fs.cp
# Sequential: 5–10 min for 1K files. Parallel write: 10–30 seconds.
date_files.select("value").coalesce(1).write.mode("overwrite").text(archive_dir)
| Files | Time | Throughput |
|---|---|---|
| 50,000 | 6 min 20 sec | 132 files/sec |
| 50,000 | 6 min 45 sec | 123 files/sec (documented benchmark) |
We had cleared the 83 files/sec target. So why isn’t this the end of the story?
Economics. A Spark cluster is, in practice, an always-on resource. You pay for cluster-hours whether or not work is flowing. Our actual job is a short burst that runs every ten minutes and finishes in minutes. Paying for a standing, always-on distributed cluster to service a small, bursty, intermittent job is the wrong cost structure.
Unity Catalog bugs worth documenting — none of these are well-surfaced in the Databricks docs:
| Bug | Fix |
|---|---|
input_file_name() throws in Unity Catalog | Use col("_metadata.file_path") |
dbutils inside UDFs is not serializable | Use native Spark write operations |
spark.read.format("binaryFile") + cast | Use spark.read.text(wholetext=True) directly — 3–5× faster |
Sequential dbutils.fs.cp archival | Takes 5–10 min per 1K files; parallel .write.text() does it in 10–30 sec |
databricks jobs create + run-now hangs | Jobs stuck in PENDING — use databricks runs submit with existing_cluster_id |
New cluster with i3.xlarge | AWS-only node type — use Standard_D4s_v3 / Standard_D8s_v3 on Azure |
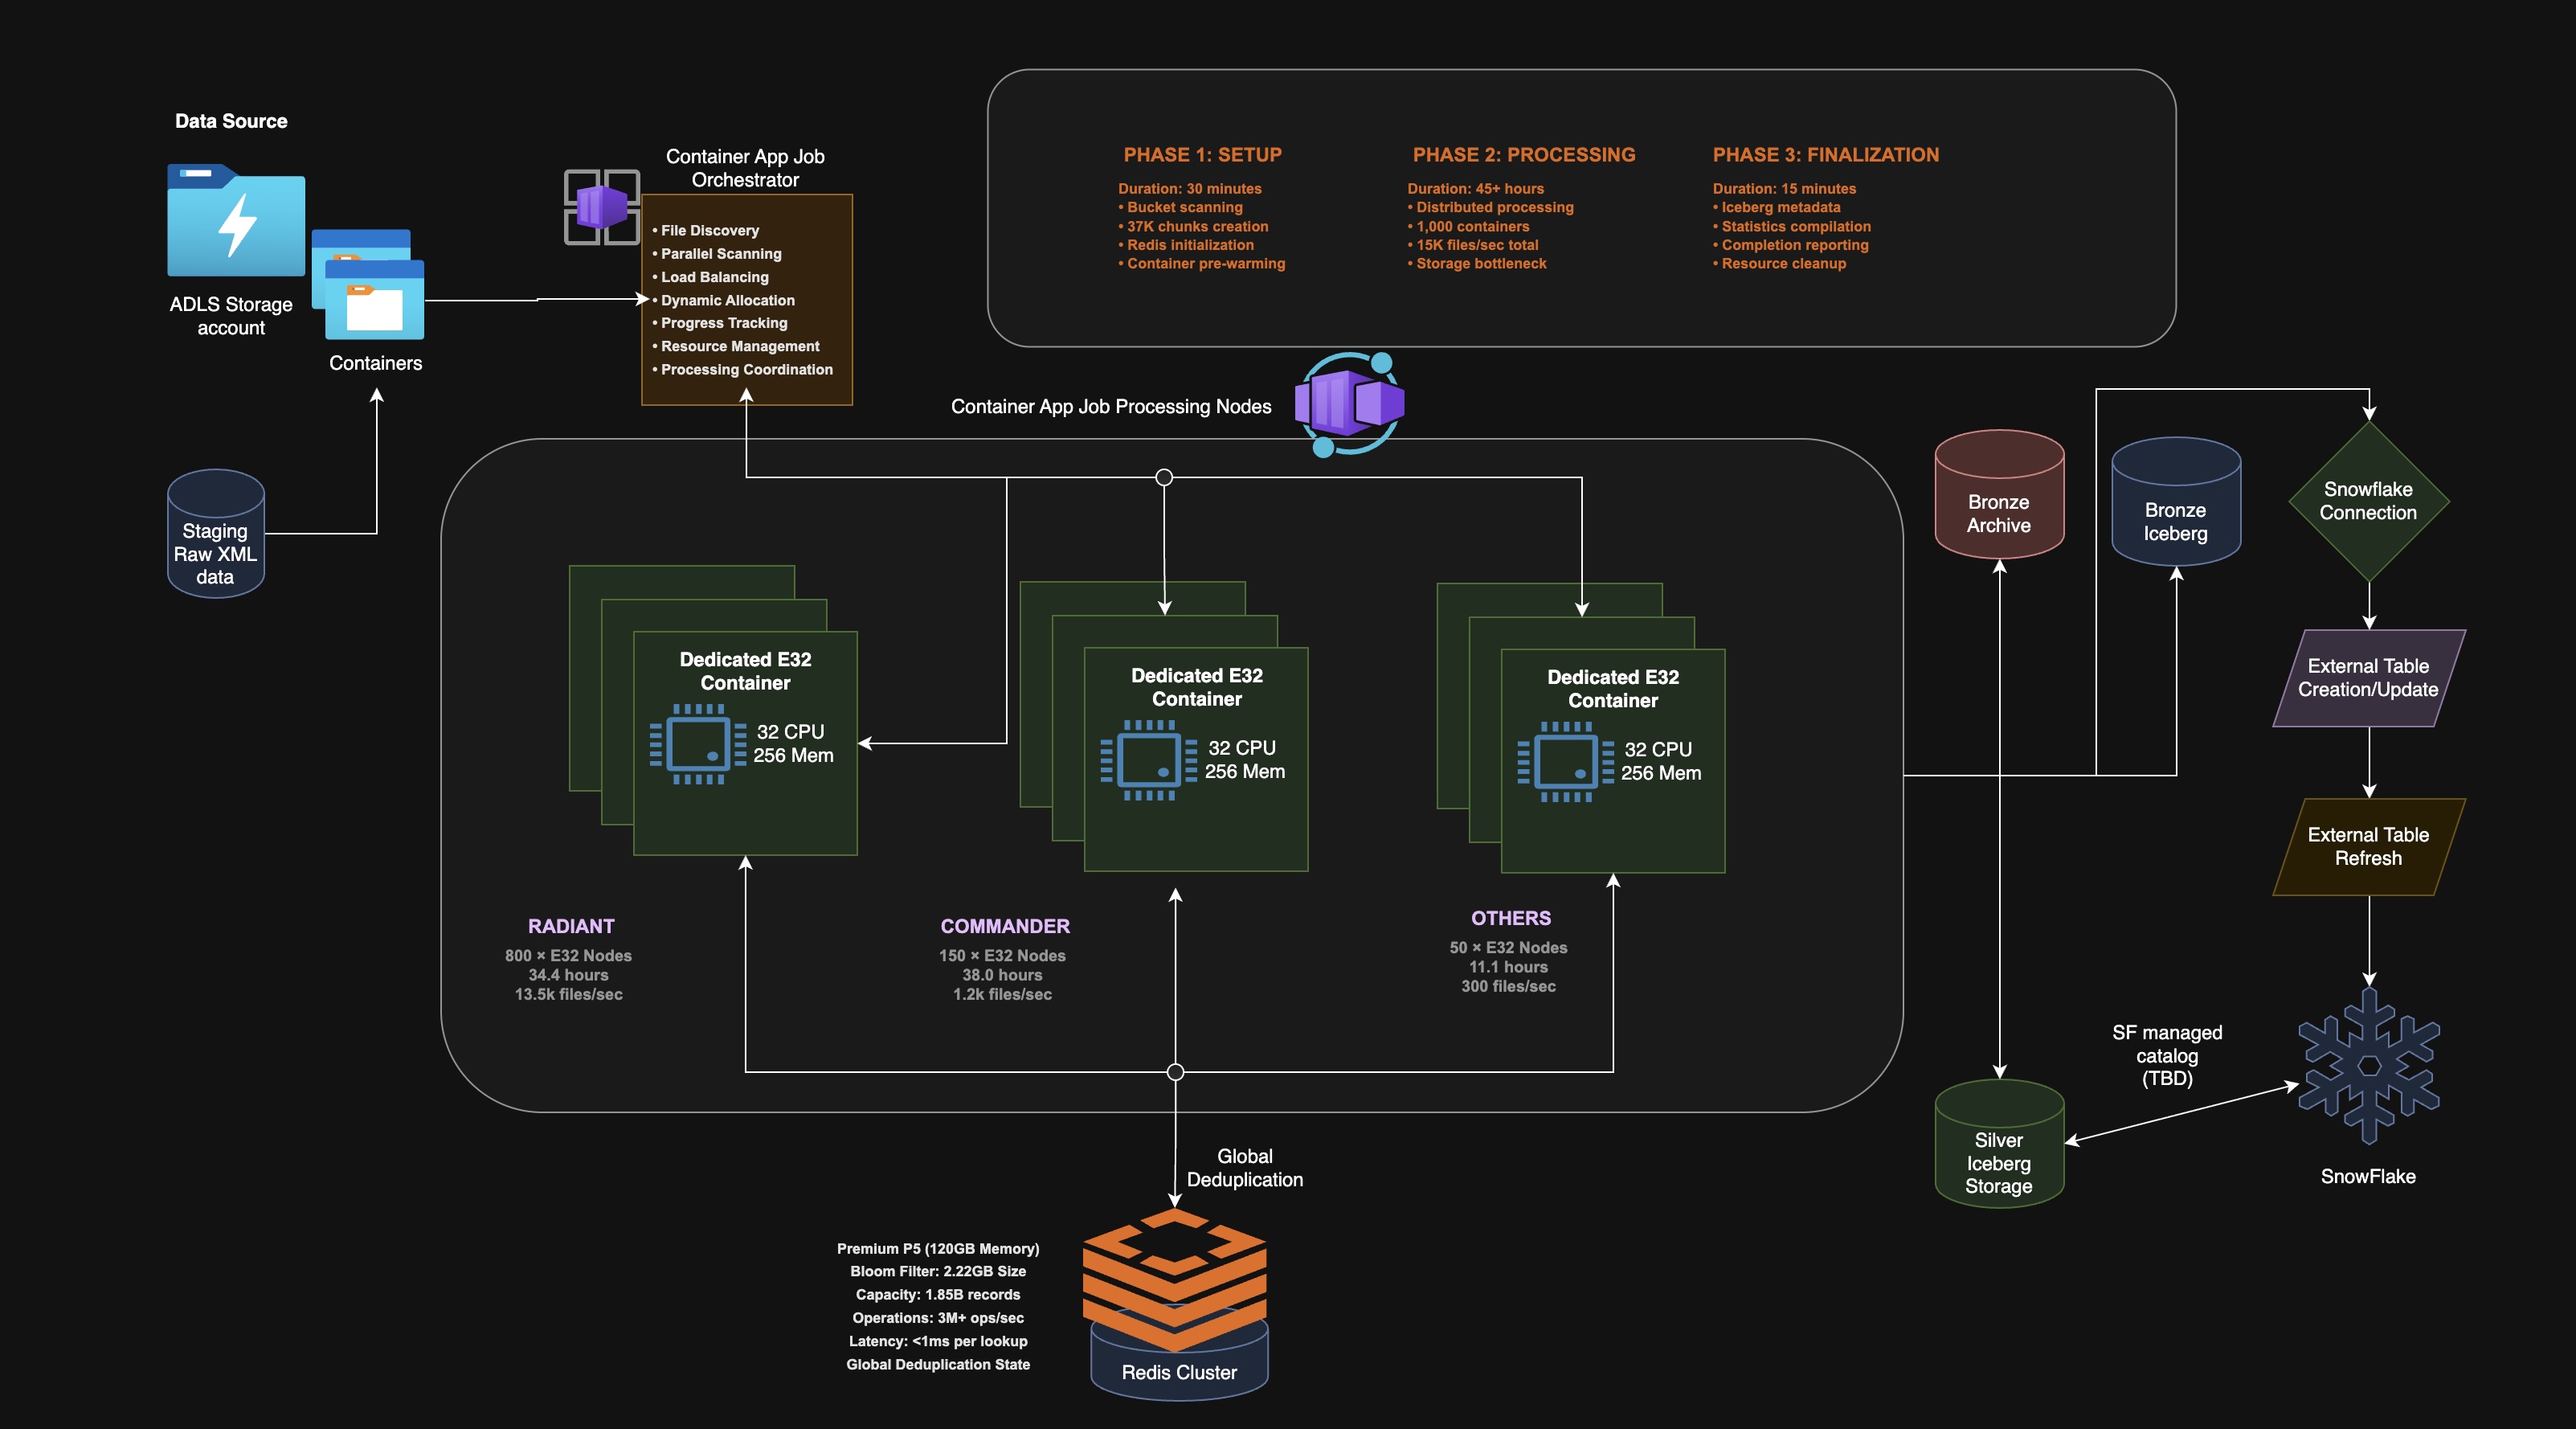
Attempt 3: serverless containers (the one we shipped)
The shipped architecture keeps the parallelism and fixes the economics. Instead of one process trying to use threads (blocked by the GIL), or a permanent cluster (wrong cost model), we run a fleet of serverless container jobs.
The key insight is about where the parallelism lives. Each container is its own operating-system process with its own Python interpreter and therefore its own GIL. The GIL only serializes threads within a single process. It says nothing about separate processes. Parallelize across processes instead of threads and the GIL stops being a ceiling.
Azure Container Apps Jobs give us process-level parallelism on a per-run billing model. The job spins up, does its work, and spins down. We pay for the seconds we actually run.
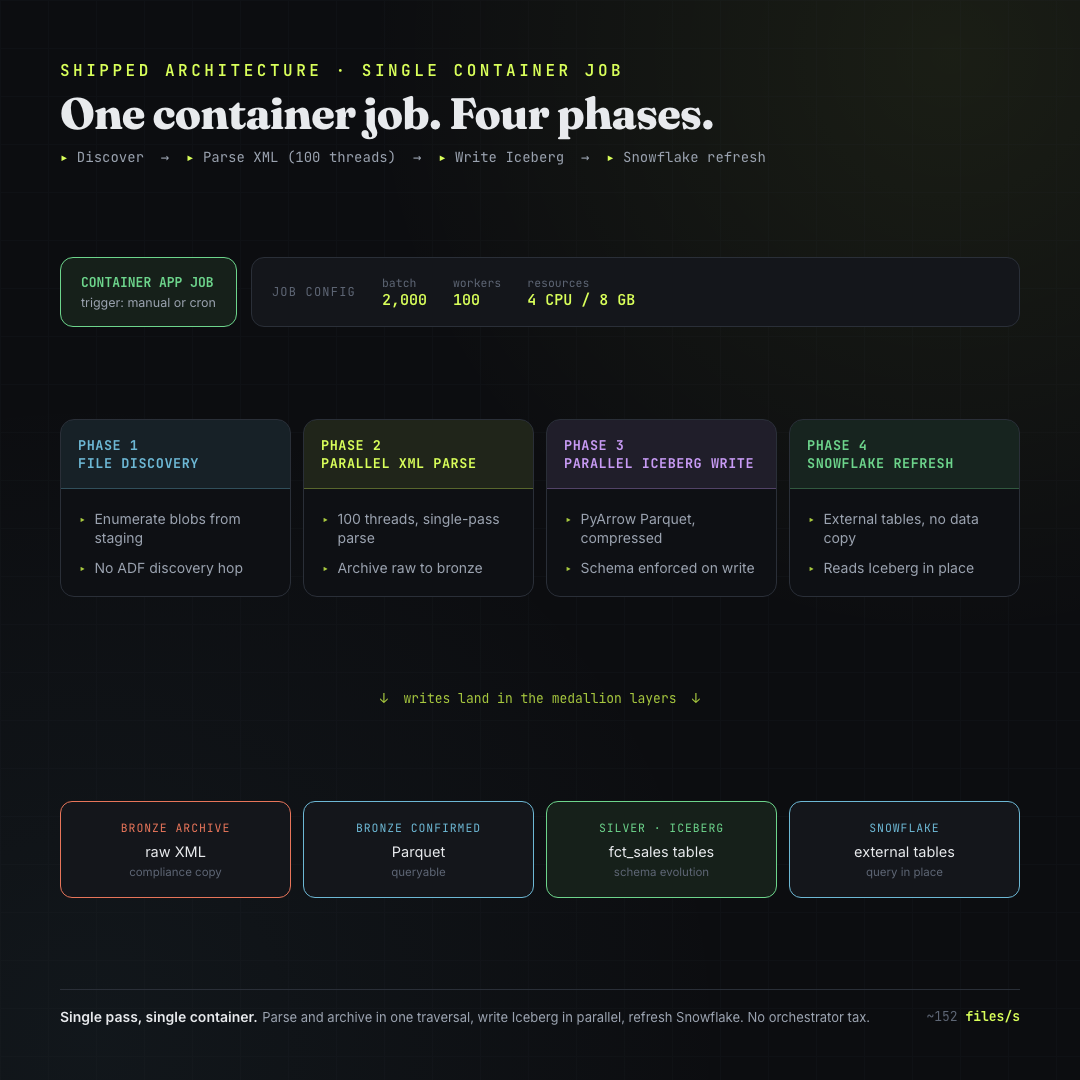
A single container job runs in four phases:
- File discovery. The job enumerates its blobs directly from staging storage — no separate ADF discovery hop and no 45-second enumeration tax on every run.
- Parallel XML parse. A
ThreadPoolExecutor(max_workers=100)handles the I/O-bound parts (downloading, archiving), while the CPU-bound parsing is distributed across containers. Each file is downloaded, archived to the bronze layer as an immutable raw copy, parsed in a single pass, and collected into memory. - Parallel Iceberg write. A second pool of 10 workers writes parsed records as PyArrow Parquet (Snappy, 2,500 records per batch) into Apache Iceberg tables — schema enforced at every write.
- Snowflake refresh. Snowflake external tables are pointed at the Iceberg data and refreshed. Data is queried in place — there is no second copy loaded into Snowflake.
The single-pass XML parser produces both silver and bronze output from one traversal — no second pass over the file:
class CompleteXMLParser:
    def extract_all_data_single_pass(self, xml_content: str):
        root = ET.fromstring(xml_content)
        # Strip {urn:vfi-sapphire:tlog.2003-06-27} from all tag names
        # Attributes become element_attr{name} columns
        # Elements with both text and children: element_tagvalue for text
        # Produces: header_record, line_records[], discount_records[]
        #       AND bronze_flat_record (all Parquet columns) simultaneously
Silver output — three fact tables in Iceberg:
sales_header— site, date, sequence number, totalssales_line— UPC, item name, quantity, amountssales_discount— promotion and discount details
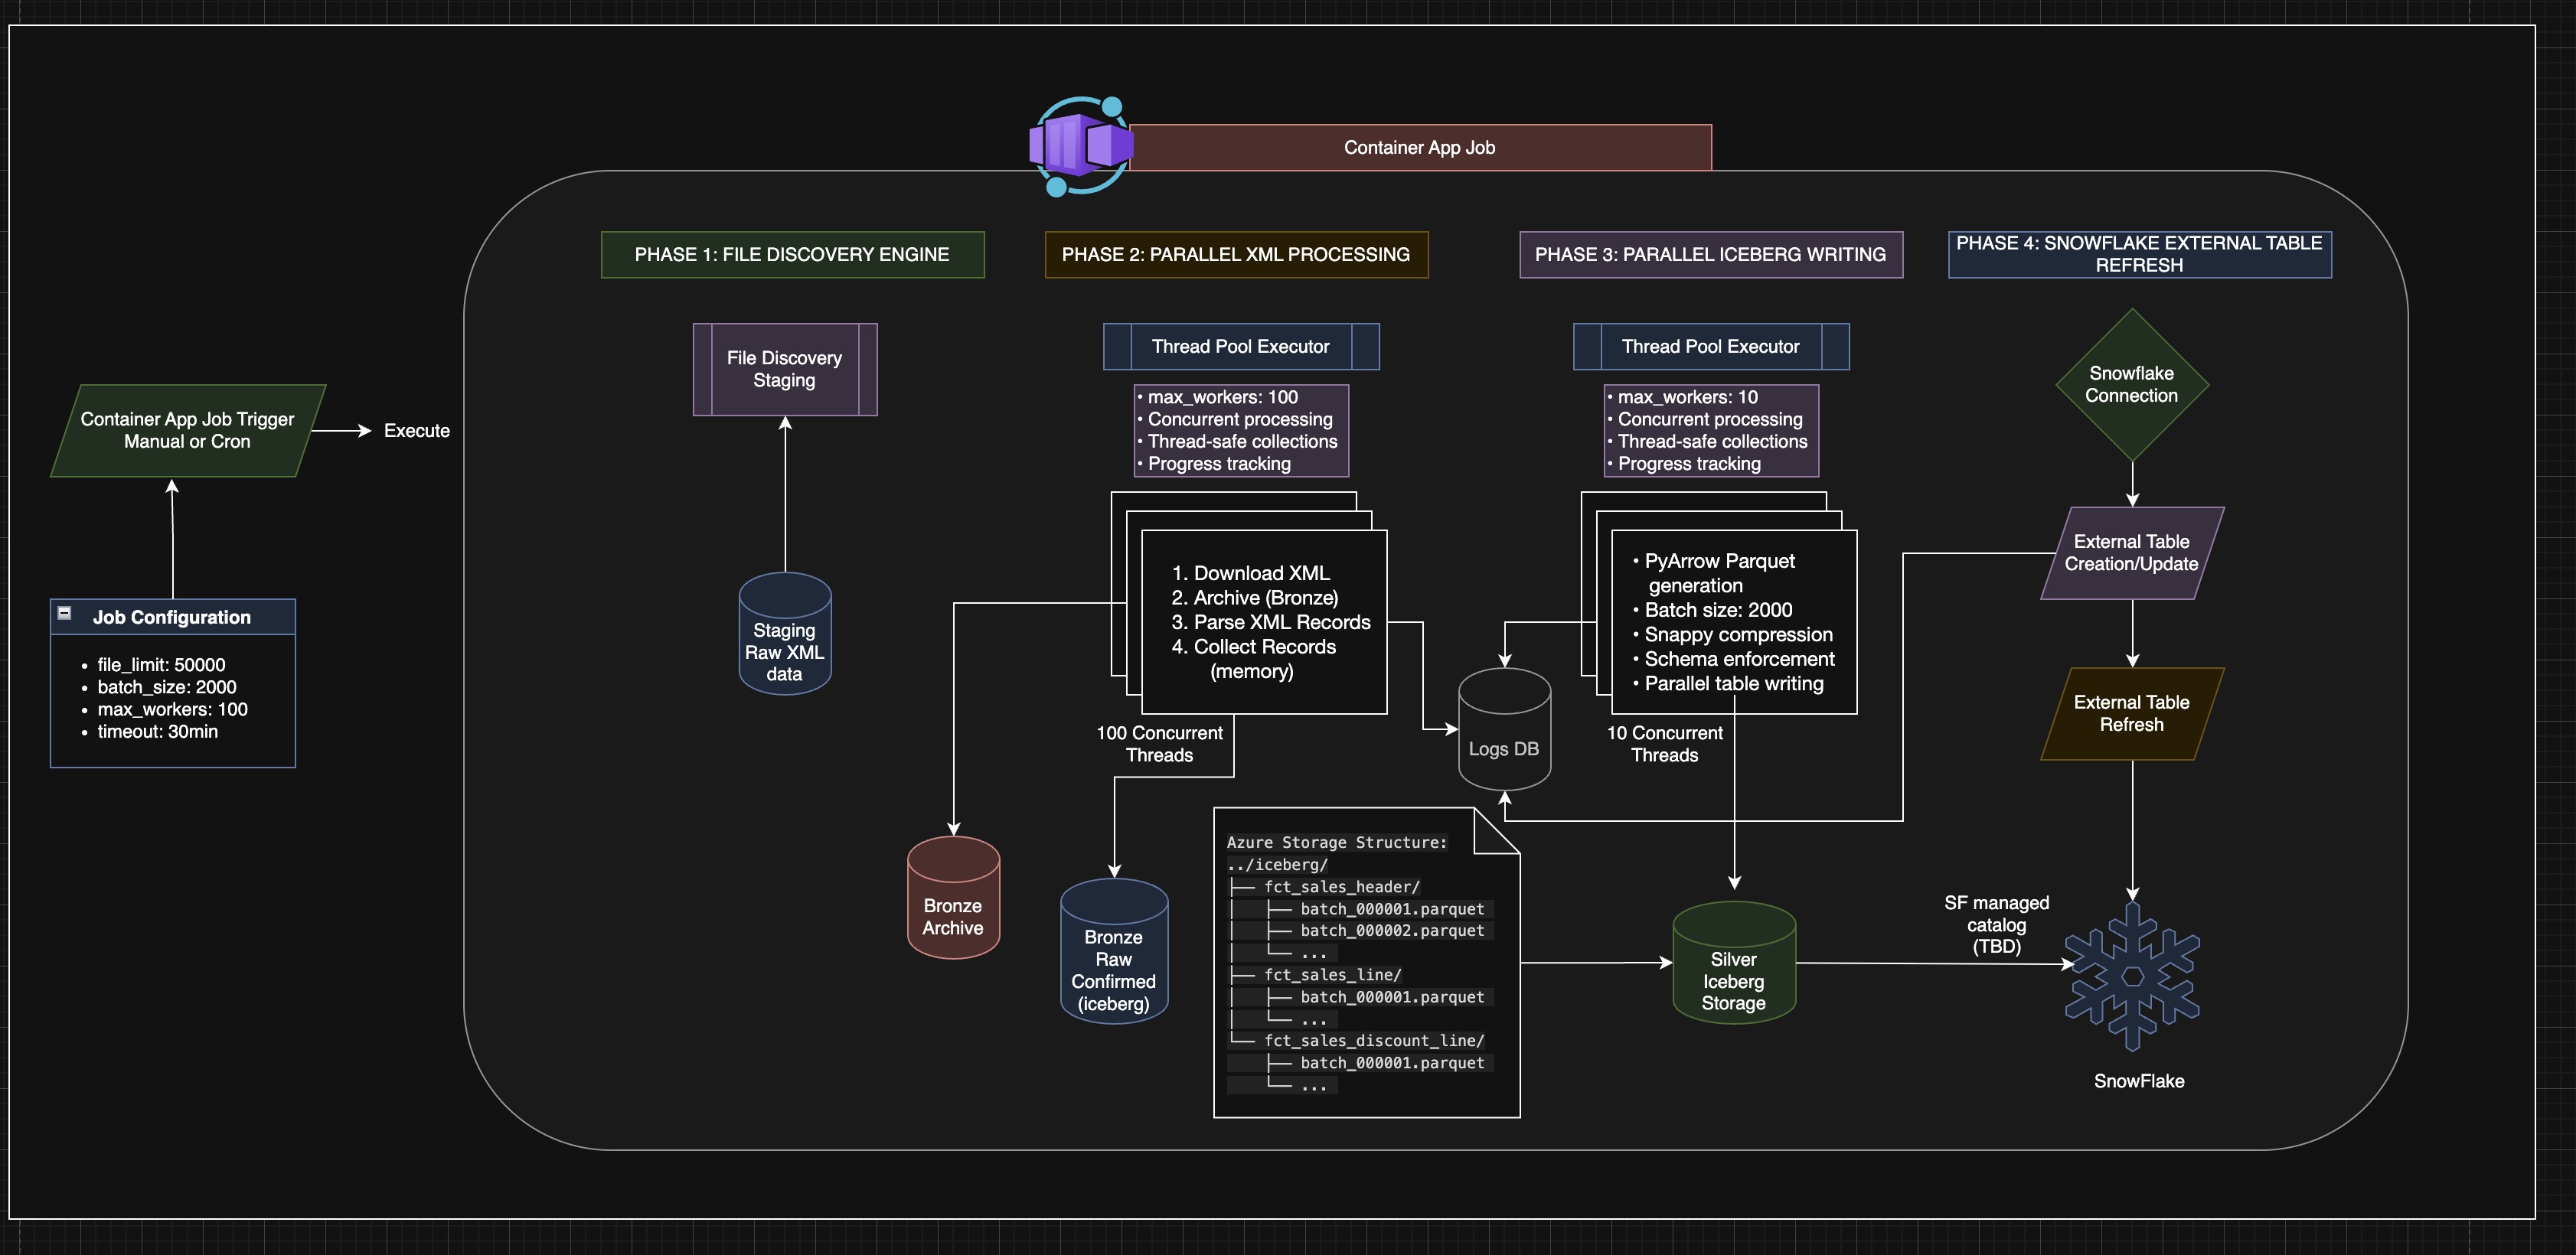
The original architecture diagram with full storage layer detail:
Results:
| Test | Files | Time | Throughput |
|---|---|---|---|
| Production 50K job with dedup | 50,000 | ~5.5 min | 152 files/sec |
| 233K chunked (5 × 50K batches) | 233,000 | 36 min | 107 files/sec |
| Bronze E2E pipeline | full run | 10 min | — |
80% cost reduction versus the Functions approach. The 233K chunked run required explicit gc.collect() between batches — each 50K batch held ~1.6 GB in memory and without it the container OOM’d at batch 2:
CHUNK_SIZE = 50_000
for chunk in chunks:
    process_chunk(chunk)
    gc.collect()  # without this: OOM at ~100K files
So the per-container story was solved. One container could process its slice quickly and cheaply. The moment you go from one container to a thousand, a new and much harder problem appears: deduplication.
The real problem: dedup is trivial on one box and brutal across a thousand
Because files re-arrive across processing cycles — the source POS systems are not idempotent — the same transaction can show up more than once. If duplicates get through, every downstream number is wrong. Dedup is correctness, not a nice-to-have.
On a single machine, dedup is the easiest thing in the world. You keep a set of the keys you have already seen, and for each new record you ask “is this in the set?” One lookup. Done.
The dedup key is a composite: site_number + transaction_sequence + business_date. That combination uniquely identifies a transaction across all stores and all time. On one container, you hold those keys in memory and check each incoming record against them.
Now scale it. The two-billion-record backload is processed by roughly one thousand containers at once, each owning a different, disjoint slice of the files. And here is the problem in one sentence:
Container 7 has no idea what container 488 has already processed. They are separate processes, very likely on separate machines. The clean little in-memory set that made dedup trivial on one box is now fragmented across a thousand isolated processes that know nothing about each other.
So the question “have I seen this record before?” stops being a local lookup and becomes a distributed, real-time, every-record question that all thousand workers are asking simultaneously. That is one of the genuinely hard problems in distributed systems.
The solution: move the shared state out of the workers
If the workers cannot share memory, the dedup state cannot live inside the workers. The fix is to pull that state out of the fleet entirely and put it in one shared store that every container queries: a single global Redis instance that all thousand workers check before writing.
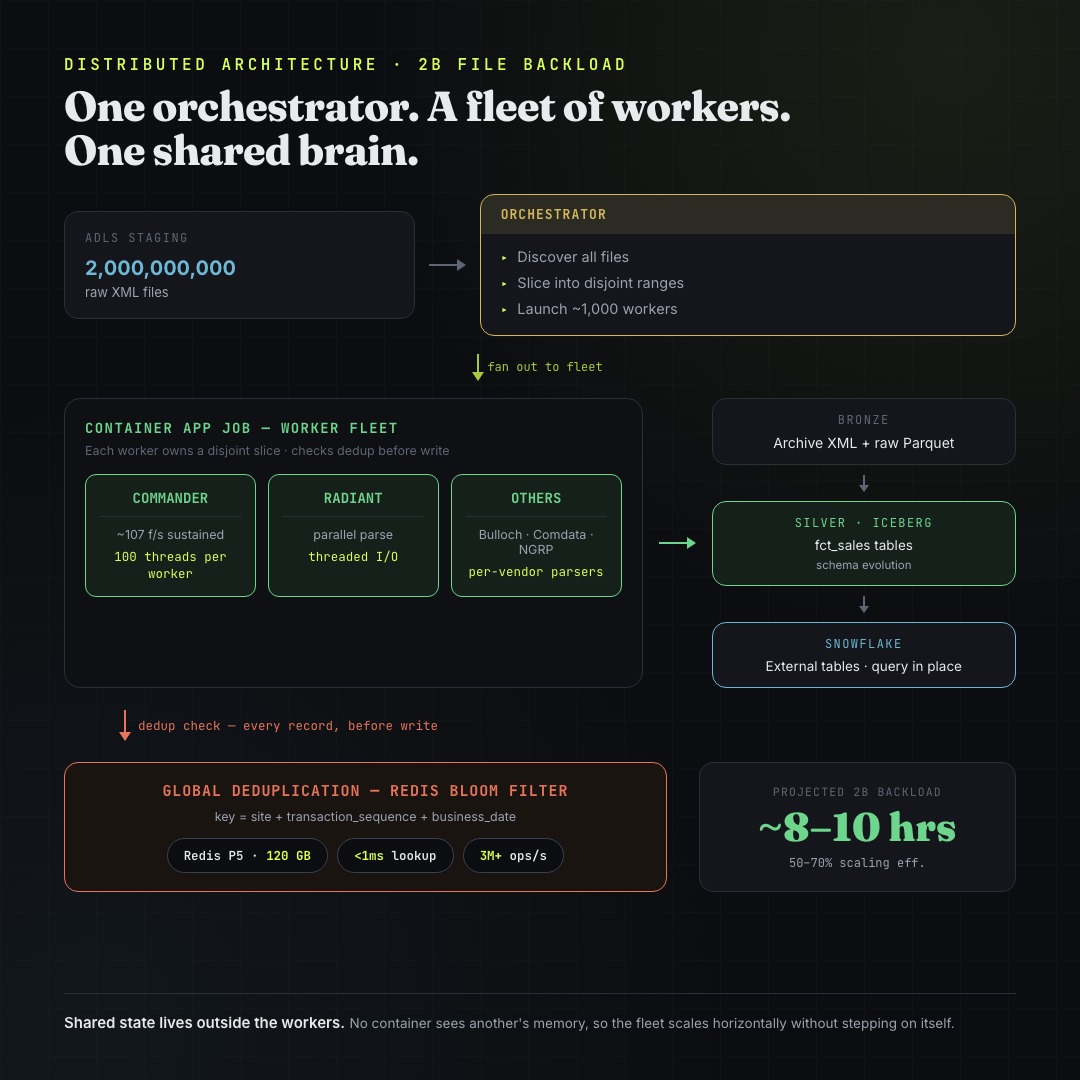
The architecture becomes:
- An orchestrator discovers all files, slices the two billion records into disjoint ranges, and launches ~1,000 worker containers, each assigned its own range.
- Each worker parses its slice exactly as the single-container job does, but before writing any record, it checks that record’s dedup key against the one shared store.
- The shared store is the single source of truth for “what has been seen.” It lives outside every worker, so it sees the global picture that no individual worker can.
That single decision — externalize the shared state — is what makes the fleet horizontally scalable. Without it, adding workers just multiplies the blind spots. With it, you can add as many workers as you want and they never step on each other, because they all consult the same brain.
Why a Bloom filter and not a plain Redis set
Externalizing the state solves correctness. But it introduces a capacity problem, and this is where the design gets interesting.
The naive version of the shared store is a plain Redis set: store every dedup key you have ever seen, and check membership against it. Simple and exact. The trouble is the size of the keyspace — and the reason is a detail that is easy to miss:
Every daily load has to dedup against all of history, forever.
A transaction that first appeared months ago could be re-sent today, and we still have to recognize it as a duplicate. The set of “keys we have seen” never resets and only grows. It is a permanent, ever-expanding keyspace.
Two billion files, each holding 50–100 transaction records, puts the total keyspace at 100 billion+ unique dedup keys. Stored as explicit keys in Redis, at ~80 bytes per key including overhead:
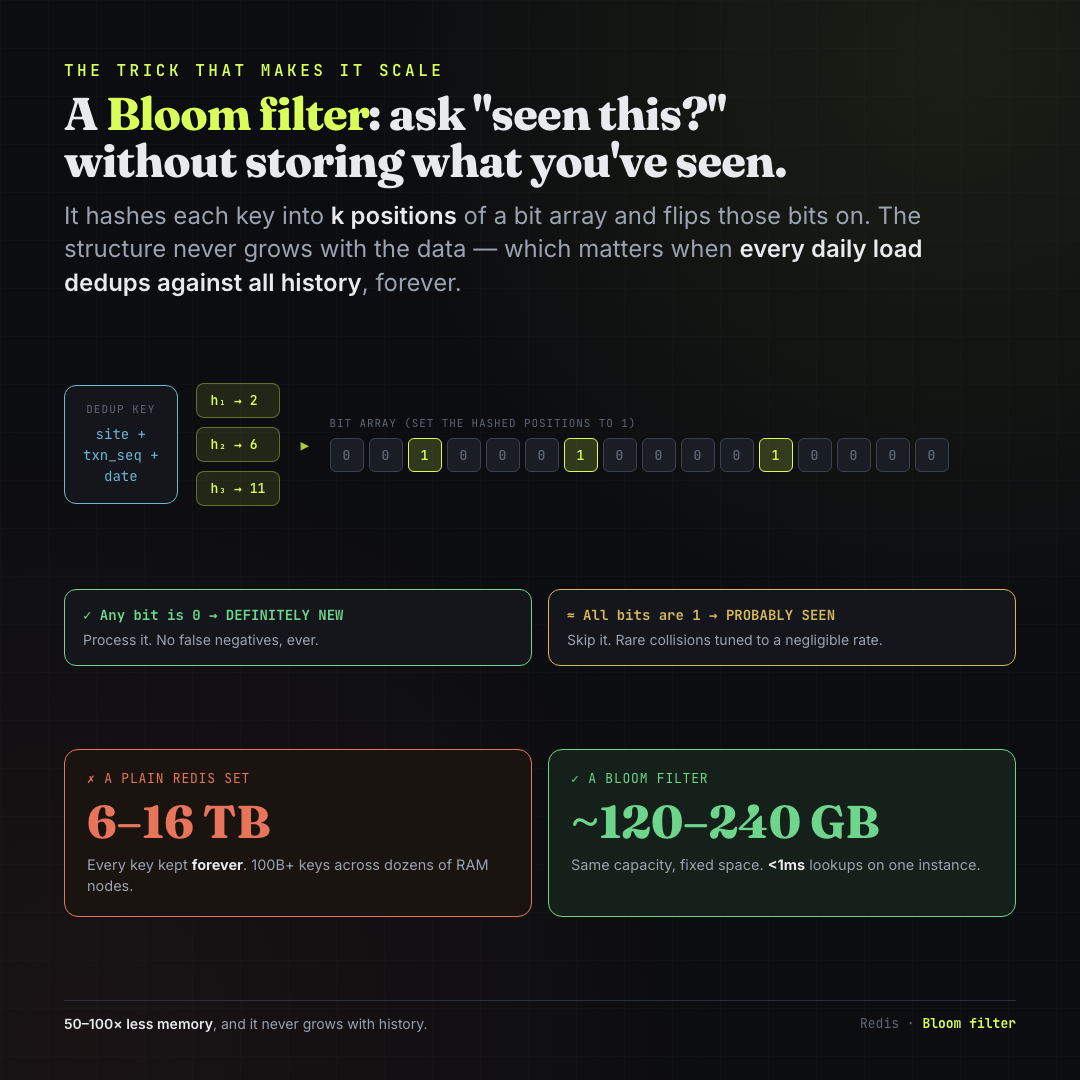
That is 50–100× less memory, on a single instance, with sub-millisecond lookups. And it never grows with history.
A Bloom filter is a probabilistic membership structure. Instead of storing keys, it keeps a fixed-size bit array. To record a key: run it through k hash functions, each pointing at a position in the bit array, and flip those bits to 1. To test a key: hash the same way and check those positions.
The crucial property: the structure never grows with the amount of data it has seen. Its size is fixed at creation time based on the expected item count and acceptable error rate.
The trade-off is a controlled, one-sided inaccuracy:
- If any checked bit is 0, the key is definitely new. No false negatives, ever. We process it.
- If all checked bits are 1, the key was probably seen. A rare hash collision can produce a false positive — we tune the filter so this rate is negligible (~1%). When all bits are 1, we treat it as a duplicate and skip it.
The deployed configuration:
| Parameter | Value |
|---|---|
| Redis tier | Premium P5 (120 GB) |
| Throughput | 3M+ ops/sec |
| Latency per lookup | <1ms |
| Connection | SSL port 6380 |
| Connection pool | 20 max connections |
| Retry strategy | Exponential backoff with jitter |
The implementation uses pipelined batch writes — hundreds of dedup checks per Redis round-trip instead of one per key:
class RedisBloomDedup:
    def is_duplicate(self, dedup_key: str) -> bool:
        # BF.EXISTS returns 1 (probable duplicate) or 0 (definitely new)
        return self.client.execute_command("BF.EXISTS", "dedup:seen_transactions", dedup_key)

    def batch_check_and_add(self, dedup_keys: list[str]) -> list:
        pipe = self.client.pipeline()
        for key in dedup_keys:
            # BF.ADD returns 0 if already present (probable duplicate), 1 if newly inserted
            pipe.execute_command("BF.ADD", "dedup:seen_transactions", key)
        return pipe.execute()
Without pipelining, each record’s dedup check is a separate Redis round-trip — at 100 threads across 50K files that is millions of individual network calls. With pipelining, hundreds of checks go in each batch, reducing round-trips by ~100×.
The 2-billion-file backload
With the single-container shape correct and the shared dedup brain in place, the full backload becomes tractable.
The orchestrator slices two billion files into disjoint ranges and fans them out to ~1,000 worker containers. Workers are sharded by vendor — each POS system gets a dedicated fleet since their XML schemas and parsing logic differ.
Each container sustains ~107 files/sec on the realistic chunked workload. It is tempting to multiply 107 × 1,000 containers and conclude the backload finishes in about five hours. That number is wrong. Real distributed fan-out loses throughput to ADLS read contention, Iceberg write coordination, stragglers, and coordination overhead — none of which the naive calculation accounts for.
What actually landed in Snowflake
After the Container Apps pipeline went live, real records reached the warehouse:
| Table | Records |
|---|---|
sales_line | 703,965 |
sales_discount | 146,041 |
Snowflake reads these as external tables pointing directly to Iceberg in ADLS Gen2 — no data copy into Snowflake’s internal storage. Schema evolution and time travel come from Iceberg’s metadata layer at no extra cost.
The complete failure log
Every project has one. This one is worth preserving.
| What Failed | Root Cause | Resolution |
|---|---|---|
| Azure Functions > 1K files | GIL + orchestrator design constraints | Moved to Databricks |
| Durable Functions at 2K files | Timeout + memory exhaustion (85% failure rate) | Abandoned entirely |
az storage CLI commands | Network deny-all rules on storage accounts | REST API with bearer tokens |
input_file_name() in Databricks | Not supported in Unity Catalog | col("_metadata.file_path") |
dbutils inside Spark UDFs | Not serializable across workers | Native Spark write operations |
databricks jobs run-now PENDING | new_cluster waits for provisioning | runs submit with existing_cluster_id |
New cluster with i3.xlarge | AWS-only node type on Azure | Standard_D4s_v3 / Standard_D8s_v3 |
spark.read.format("binaryFile") | Slow binary path with casting overhead | spark.read.text(wholetext=True) |
Sequential dbutils.fs.cp archival | 5–10 min per 1K files | Parallel Spark .write.text() |
| Memory OOM at 233K files | Single container exceeds 8GB without GC | 50K batches with gc.collect() between |
The Azure CLI issue deserves a specific note. Storage accounts had network deny-all rules blocking every az storage command. The workaround was the Azure management REST API with bearer tokens for everything:
TOKEN=$(az account get-access-token --query accessToken -o tsv)
curl -H "Authorization: Bearer $TOKEN" \
  "https://management.azure.com/subscriptions/{sub}/resourceGroups/{rg}/providers/..."
Verbose but reliable. The same pattern worked for querying ADF pipeline run history via queryPipelineRuns.
All the numbers
| Metric | Value |
|---|---|
| Original pipeline | 0.08 files/sec — 113 files in 23 min |
| Business requirement | 83.33 files/sec — 50K in under 10 min |
| Azure Functions best (after optimization) | 59 files/sec |
| Databricks Photon | 123–132 files/sec |
| Container Apps 50K job | 152 files/sec |
| Container Apps 233K chunked | 107 files/sec |
| Performance improvement vs original | 595× – 1,900× |
| Functions → Container Apps cost | 80% reduction |
| Bloom filter vs plain Redis set | 120–240 GB vs 6–16 TB — 50–100× less memory |
| Redis throughput | 3M+ ops/sec, <1ms per lookup |
| Thread workers per container | 100 |
| Chunk size | 50K files / ~1.6 GB RAM each |
| Parquet batch size | 2,500 records per write |
| Historic backload (projected) | 2B files in ~8–10 hrs at 1,000-container fleet |
What this project was actually about
It is easy to read this as a story about picking the right Azure service. It is not. The services are incidental. The actual throughline is a way of thinking.
The first attempt failed because we treated an architecture problem as a performance problem. We optimized hard inside a model that structurally forbade what we needed, and no amount of profiling could have saved it. The second attempt succeeded technically and failed economically — which taught us that “it is fast now” is only half an answer. The third attempt worked because we matched the shape of the solution to the shape of the problem: bursty, parallelizable work wants pay-per-run process-level parallelism; an ever-growing global membership question wants a fixed-size probabilistic structure with shared state pulled out of the workers.
The single most important line from the whole effort is still the one from the first dead end:
You can't optimize your way out of an architecture that forbids what you need.
Senior engineering is not writing faster loops. It is recognizing when the architecture itself is the cost — and being willing to change its shape.
Stack: Python 3.11 · Azure Container Apps Jobs · Azure Databricks (Photon) · Apache Iceberg · Azure ADLS Gen2 · Azure Cache for Redis (Premium P5) · Snowflake External Tables · PyArrow · azure-storage-blob