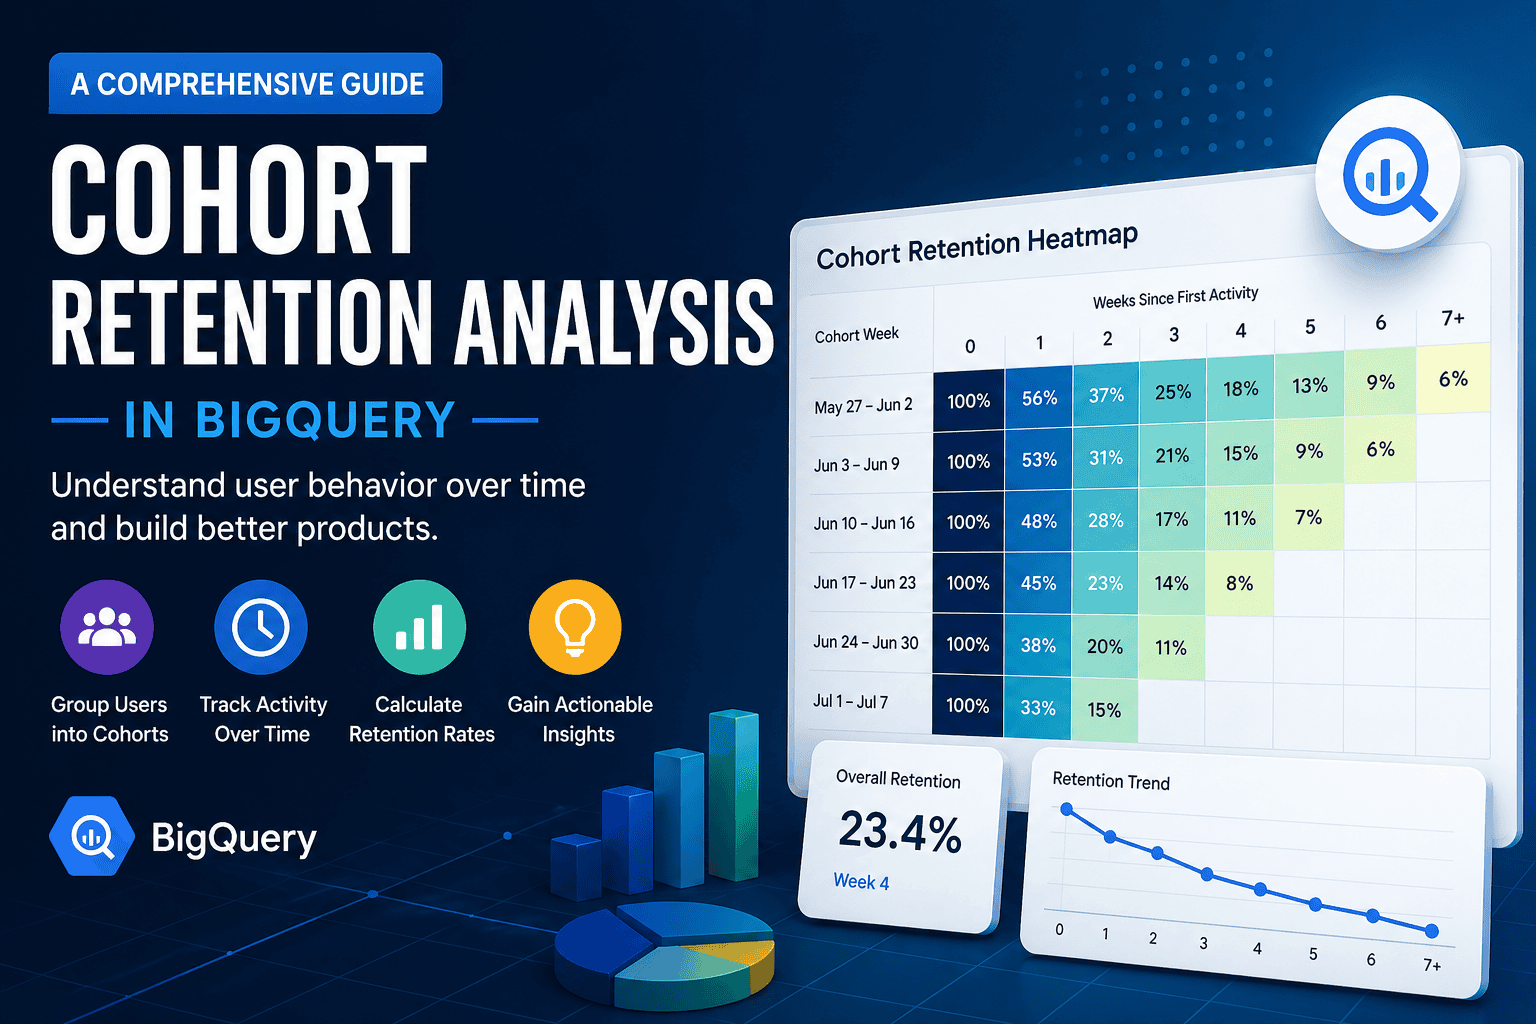
Cohort retention analysis is one of those things that sounds fancy but boils down to a simple question: are your users coming back? This post walks through building it from scratch in BigQuery — no external datasets, just a small synthetic table we’ll create together.
What is a Cohort?
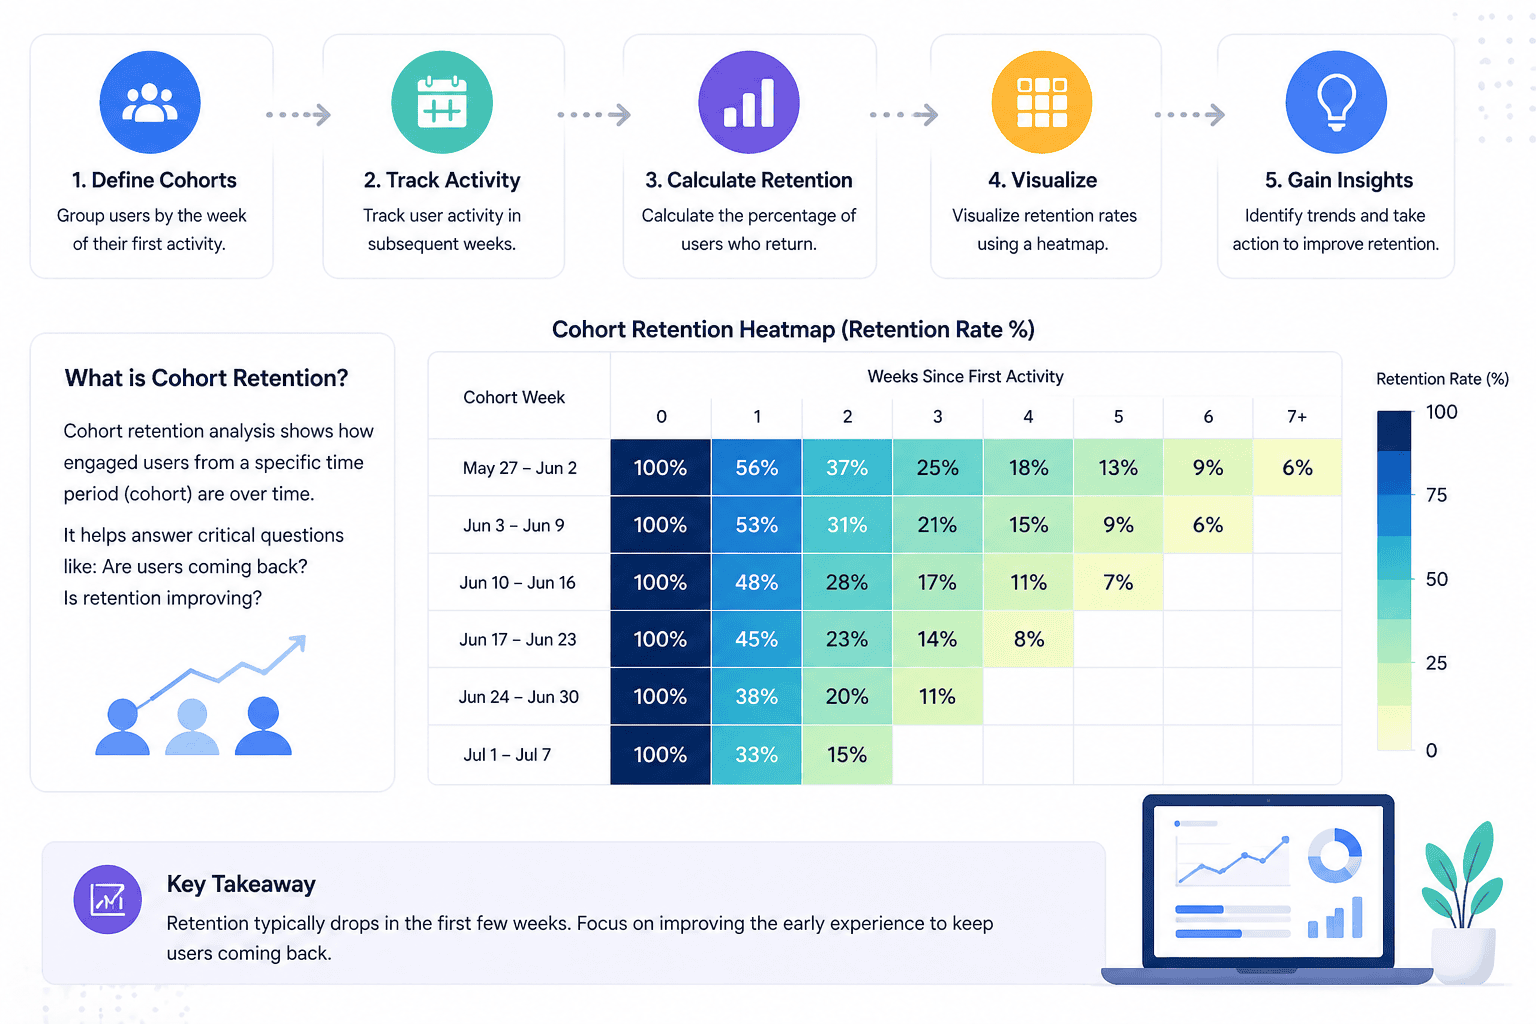
A cohort is a group of users who share a common starting point — usually their first interaction with your product. The most common definition is: all users who first showed up in the same week (or month).
So users who first visited your app during the week of 2024-01-01 form one cohort, and users who first visited during 2024-01-08 form another.
What is Retention?
Retention measures how many users from a cohort came back in a later period.
- 100 users join in Week 0
- 40 of them return in Week 1 → 40% Week 1 retention
- 20 of them return in Week 2 → 20% Week 2 retention
Week 0 retention is always 100% — it’s just the cohort size itself.
Setting Up Sample Data
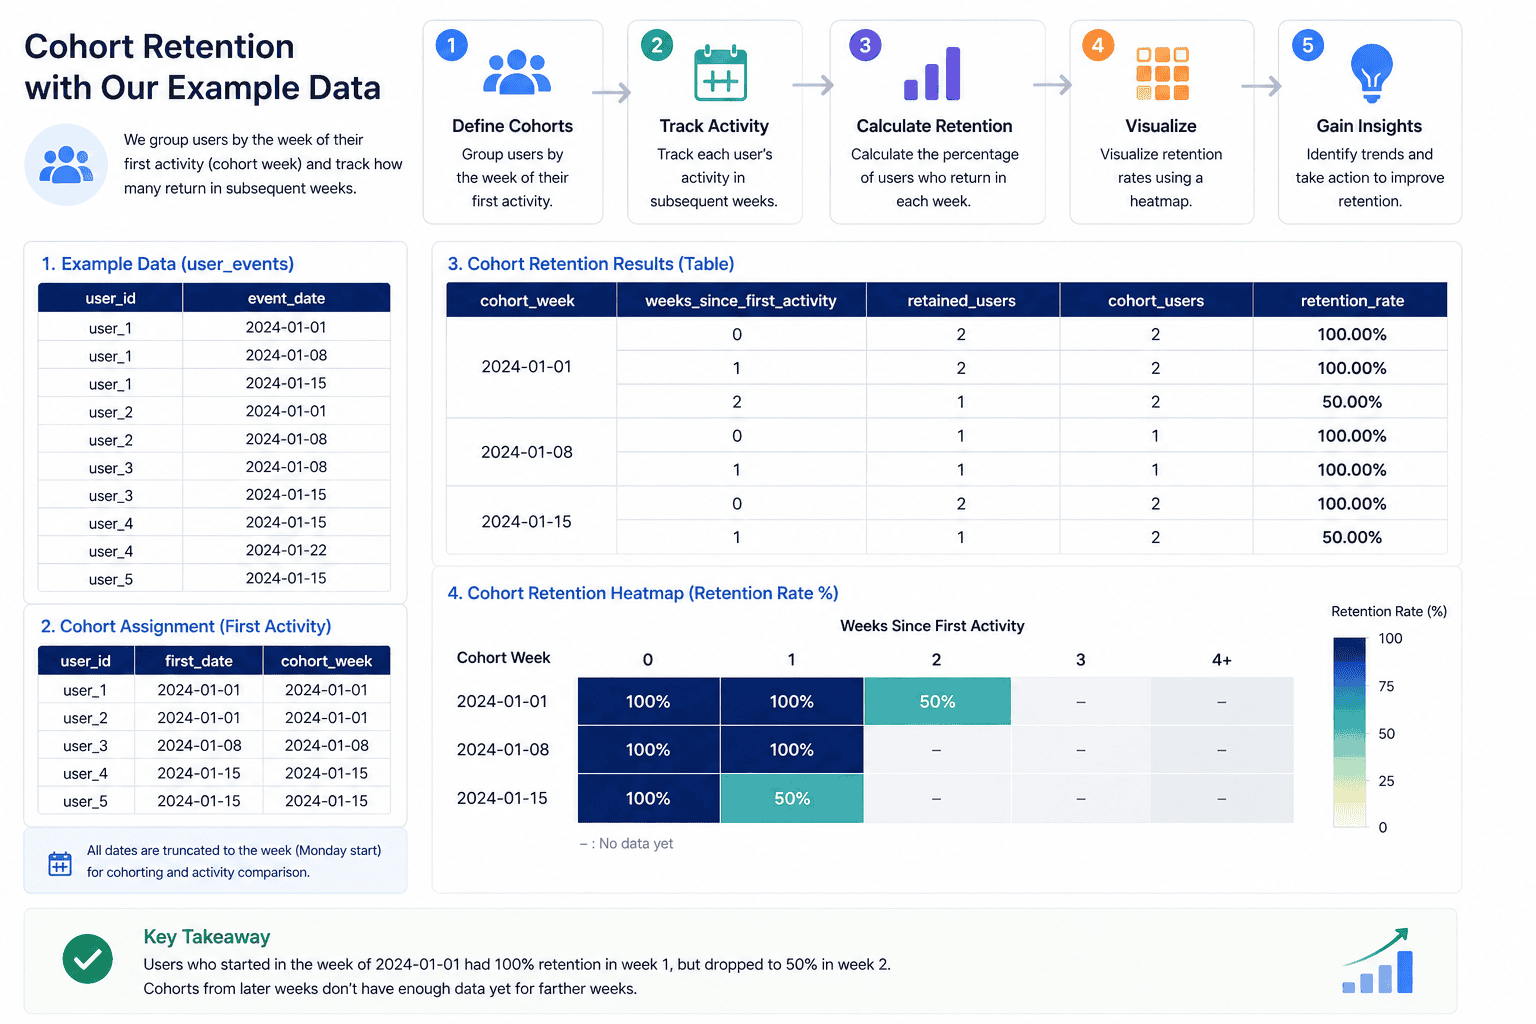
We’ll create a simple user_events table with a user_id and an event_date. This mimics any real events table — pageviews, app opens, purchases, whatever your product tracks.
CREATE OR REPLACE TABLE `your_project.analytics_demo.user_events` AS
SELECT * FROM UNNEST([
  STRUCT("user_1" AS user_id, DATE "2024-01-01" AS event_date),
  ("user_1", DATE "2024-01-08"),
  ("user_1", DATE "2024-01-15"),

  ("user_2", DATE "2024-01-01"),
  ("user_2", DATE "2024-01-08"),

  ("user_3", DATE "2024-01-08"),
  ("user_3", DATE "2024-01-15"),

  ("user_4", DATE "2024-01-15"),
  ("user_4", DATE "2024-01-22"),

  ("user_5", DATE "2024-01-15")
]);
A quick sanity check before we start:
-- total distinct users
SELECT COUNT(DISTINCT user_id) AS total_users
FROM `your_project.analytics_demo.user_events`;

-- active users per week
SELECT
  DATE_TRUNC(event_date, WEEK) AS week,
  COUNT(DISTINCT user_id) AS active_users
FROM `your_project.analytics_demo.user_events`
GROUP BY 1
ORDER BY 1;
Building Cohort Retention
The analysis has a few clear pieces. We’ll build each one, then combine them.
Step 1: Find each user’s first activity date
WITH first_activity AS (
  SELECT
    user_id,
    MIN(event_date) AS first_date
  FROM `your_project.analytics_demo.user_events`
  GROUP BY user_id
)
SELECT * FROM first_activity;
Step 2: Assign users to a cohort week
We truncate first_date to the week boundary so users who joined on different days within the same week are grouped together.
WITH first_activity AS (
  SELECT
    user_id,
    MIN(event_date) AS first_date
  FROM `your_project.analytics_demo.user_events`
  GROUP BY user_id
)
SELECT
  user_id,
  DATE_TRUNC(first_date, WEEK) AS cohort_week
FROM first_activity;
Step 3: Get all weekly activity
SELECT
  user_id,
  DATE_TRUNC(event_date, WEEK) AS activity_week
FROM `your_project.analytics_demo.user_events`;
Step 4: Join cohort to activity
This gives us one row per (user, activity week), carrying the user’s cohort week along.
WITH first_activity AS (
  SELECT user_id, MIN(event_date) AS first_date
  FROM `your_project.analytics_demo.user_events`
  GROUP BY user_id
),
cohort AS (
  SELECT
    user_id,
    DATE_TRUNC(first_date, WEEK) AS cohort_week
  FROM first_activity
),
activity AS (
  SELECT
    user_id,
    DATE_TRUNC(event_date, WEEK) AS activity_week
  FROM `your_project.analytics_demo.user_events`
)
SELECT
  c.cohort_week,
  a.activity_week,
  c.user_id
FROM cohort c
JOIN activity a
  ON c.user_id = a.user_id
  AND a.activity_week >= c.cohort_week;
The activity_week >= cohort_week filter makes sure we only look at activity after (or at) the user’s cohort week.
Step 5: Calculate weeks since first activity
DATE_DIFF gives us the distance between the activity week and the cohort week — this becomes our retention period index.
WITH first_activity AS (
  SELECT user_id, MIN(event_date) AS first_date
  FROM `your_project.analytics_demo.user_events`
  GROUP BY user_id
),
cohort AS (
  SELECT
    user_id,
    DATE_TRUNC(first_date, WEEK) AS cohort_week
  FROM first_activity
),
activity AS (
  SELECT
    user_id,
    DATE_TRUNC(event_date, WEEK) AS activity_week
  FROM `your_project.analytics_demo.user_events`
),
retention AS (
  SELECT
    c.cohort_week,
    DATE_DIFF(a.activity_week, c.cohort_week, WEEK) AS weeks_since_first_activity,
    c.user_id
  FROM cohort c
  JOIN activity a
    ON c.user_id = a.user_id
    AND a.activity_week >= c.cohort_week
)
SELECT
  cohort_week,
  weeks_since_first_activity,
  COUNT(DISTINCT user_id) AS retained_users
FROM retention
GROUP BY 1, 2
ORDER BY 1, 2;
Step 6: Add cohort size and retention rate
The last piece — divide retained users by cohort size to get the percentage.
WITH first_activity AS (
  SELECT user_id, MIN(event_date) AS first_date
  FROM `your_project.analytics_demo.user_events`
  GROUP BY user_id
),
cohort AS (
  SELECT
    user_id,
    DATE_TRUNC(first_date, WEEK) AS cohort_week
  FROM first_activity
),
activity AS (
  SELECT
    user_id,
    DATE_TRUNC(event_date, WEEK) AS activity_week
  FROM `your_project.analytics_demo.user_events`
),
retention AS (
  SELECT
    c.cohort_week,
    DATE_DIFF(a.activity_week, c.cohort_week, WEEK) AS weeks_since_first_activity,
    c.user_id
  FROM cohort c
  JOIN activity a
    ON c.user_id = a.user_id
    AND a.activity_week >= c.cohort_week
),
retention_count AS (
  SELECT
    cohort_week,
    weeks_since_first_activity,
    COUNT(DISTINCT user_id) AS retained_users
  FROM retention
  GROUP BY 1, 2
),
cohort_size AS (
  SELECT
    cohort_week,
    COUNT(DISTINCT user_id) AS cohort_users
  FROM cohort
  GROUP BY 1
)
SELECT
  r.cohort_week,
  r.weeks_since_first_activity,
  r.retained_users,
  c.cohort_users,
  ROUND(r.retained_users / c.cohort_users * 100, 2) AS retention_rate
FROM retention_count r
JOIN cohort_size c ON r.cohort_week = c.cohort_week
ORDER BY 1, 2;
Reading the Output
With our sample data, you’ll see something like:
| cohort_week | week | retained_users | cohort_users | retention_rate |
|---|---|---|---|---|
| 2024-01-01 | 0 | 2 | 2 | 100% |
| 2024-01-01 | 1 | 2 | 2 | 100% |
| 2024-01-01 | 2 | 1 | 2 | 50% |
| 2024-01-08 | 0 | 2 | 2 | 100% |
| 2024-01-08 | 1 | 2 | 2 | 100% |
| 2024-01-15 | 0 | 2 | 2 | 100% |
| 2024-01-15 | 1 | 1 | 2 | 50% |
- Week 0 is always 100% — it’s the cohort’s starting point
- Each subsequent week shows how many held on
- Newer cohorts have fewer columns — there’s simply no future data yet, and that’s expected
Visualizing with a Heatmap
Export the result as CSV and pivot it in Python:
import pandas as pd
import seaborn as sns
import matplotlib.pyplot as plt

df = pd.read_csv("retention.csv")

heatmap = df.pivot_table(
    values="retention_rate",
    index="cohort_week",
    columns="weeks_since_first_activity"
)

plt.figure(figsize=(12, 6))
sns.heatmap(heatmap, annot=True, fmt=".1f", cmap="YlGnBu")
plt.title("Weekly Cohort Retention (%)")
plt.tight_layout()
plt.show()
The heatmap makes drop-off patterns immediately obvious — you can spot at a glance whether Week 2 retention improved for newer cohorts compared to older ones.
Pitfalls
Grouping by event week instead of first activity week. A user who joined in January and is active in March belongs to the January cohort, not the March one. Always anchor on MIN(event_date).
Counting events instead of users. If a user triggers 10 events in a week, they should still count as 1 retained user. Use COUNT(DISTINCT user_id).
Treating empty cells as zero. The bottom-right triangle of a cohort table is empty because those weeks haven’t happened yet — not because users churned. Don’t fill them with zeros.
Mixing time granularities. If you truncate cohort assignment to weeks but activity to days (or vice versa), the join breaks. Keep both on the same grain throughout.